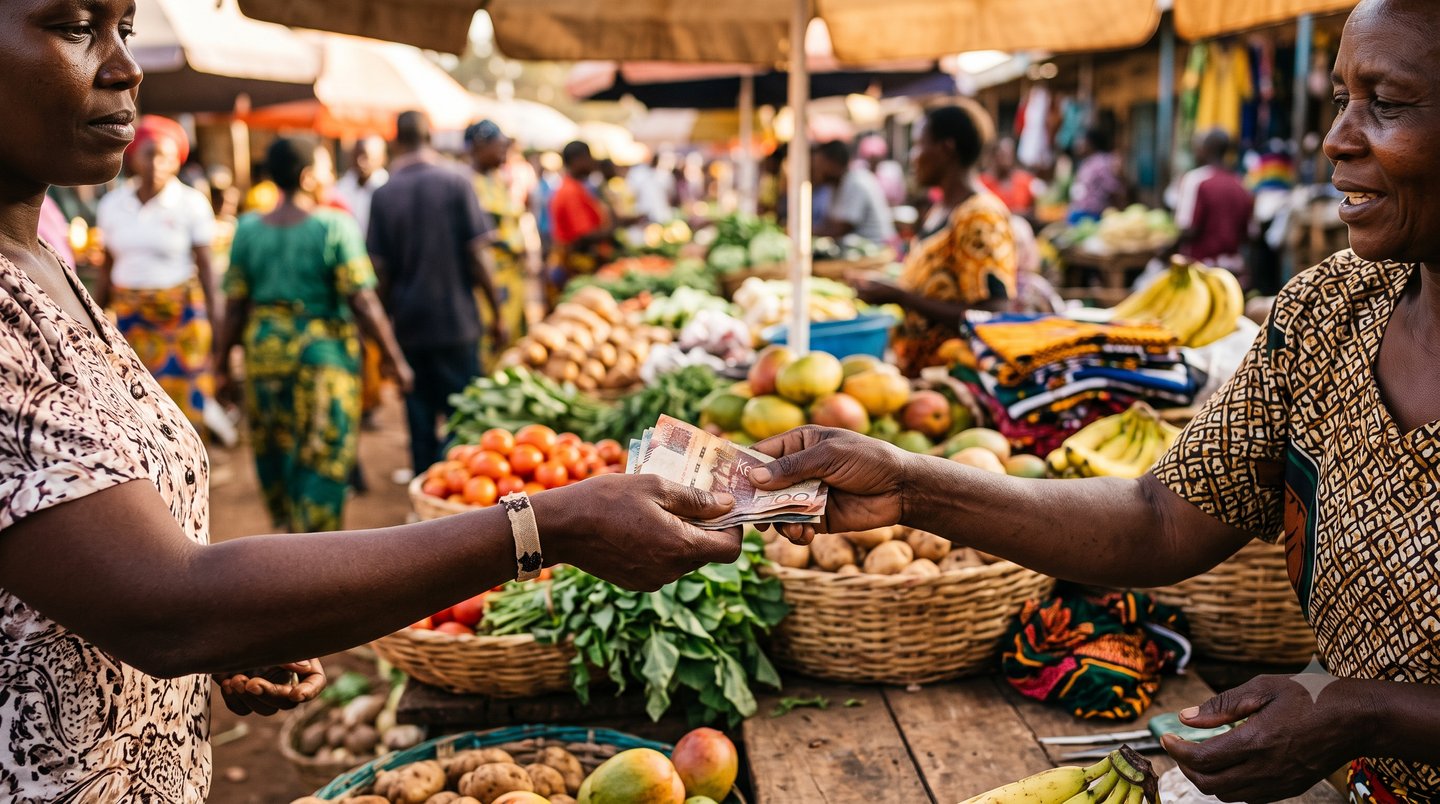
Around the world, millions of people live below the poverty line, yet remain invisible in official budgets, planning documents, and policy debates. Traditional surveys are expensive, slow, and often miss the most vulnerable households. Today, advanced data-driven methods are changing that reality, allowing researchers, NGOs, governments, and impact investors to find and understand deprivation in ways that were impossible just a few years ago.
Modern AI tools list can sift through satellite imagery, mobile data, public records, social media, and even text-based research reports to draw a clearer, more detailed map of who needs help, where, and why. By identifying patterns hidden in complex datasets, they give decision-makers a sharper lens on economic hardship and a more reliable way to allocate resources where they will matter most.
1. Satellite Image Analysis for Mapping Deprivation
One of the most powerful applications of advanced analytics in social impact is the use of satellite imagery. High-resolution images of neighborhoods, farmland, roads, and infrastructure can be processed to reveal indicators of economic well-being: roof materials, building density, road quality, access to electricity, and nearby services such as schools and clinics.
Instead of sending survey teams door-to-door, organizations can feed large collections of satellite images into models trained to estimate income levels or living standards. These models quickly generate poverty maps at neighborhood or village level, highlighting areas that lack investment or essential services. This approach is particularly effective in remote or conflict-affected regions where traditional data collection is not feasible.
2. Mobile Phone Data for Real-Time Economic Signals
Mobile usage patterns can reveal how people move, communicate, and spend money. Aggregated, anonymized data from mobile networks—such as call frequency, top-up behavior, and mobility between locations—can act as a proxy for economic activity and social connectivity.
Models trained on these data streams can detect shifts in livelihood conditions, such as sudden drops in activity that may indicate job losses, migration, or climate-related shocks. This enables governments and humanitarian organizations to deploy targeted assistance faster, focusing on districts where economic stress is intensifying, without waiting months for traditional survey results.
3. Geospatial Poverty Indexing for Precision Targeting
Combining multiple datasets—satellite imagery, census data, public infrastructure registries, environmental variables—makes it possible to build detailed geospatial indices of deprivation. These indices break down national or regional statistics into granular grids, often just a few hundred meters wide.
With these layered maps, planners can pinpoint not just which region is poor, but which specific communities lack roads, clinics, schools, safe water, or stable employment opportunities. This precision supports smarter social programs, from cash transfers and food distribution to investments in clinics, irrigation, or broadband connectivity.
4. Social Media and Web Data for Early Warning Signals
Public posts on social platforms, online classifieds, community forums, and local news websites can contain early hints of economic distress—rising food prices, reports of layoffs, spikes in informal job offers, or growing mentions of hunger and debt. While noisy and unstructured, these signals can be invaluable when processed at scale.
Text analysis models can sift through millions of posts, detect recurring themes, sentiment, and localized concerns, and correlate them with geographic regions. This offers a low-cost way to complement official statistics, helping agencies spot emerging hardships before they escalate into deep crises.
5. Transaction and Market Data to Track Household Vulnerability
Digital payment systems, savings groups, microfinance platforms, and small merchant networks generate a steady stream of transaction data. When anonymized and aggregated, these records help reveal how households and small businesses manage income, savings, and debt.
Advanced analytical methods can identify households at risk of falling into deeper poverty: those with shrinking balances, repeated late payments, or irregular incomes in specific seasons. Financial institutions and NGOs can then design more tailored products—flexible repayment schedules, emergency credit, or insurance—to help families weather economic shocks without sliding further into hardship.
6. Natural Language Processing on Reports and Policy Documents
Vast knowledge about poverty sits in PDFs: academic papers, project evaluations, government strategies, and NGO reports. These documents are often underused because they are scattered across institutions and written in different formats.
Text analysis techniques can scan and structure thousands of such documents, extracting key themes: which interventions worked, in what context, and for whom. By linking insights across countries and projects, they help practitioners avoid repeating mistakes, scale what works, and adapt successful models to new regions.
7. Predictive Models for Climate and Livelihood Risks
Climate change is pushing many households into deeper vulnerability through droughts, floods, and extreme weather. Forecast models that combine climate data with information on crops, land use, and local livelihoods can estimate where and when poverty risks are likely to spike.
These tools help development agencies prioritize climate adaptation investments—such as drought-resistant seeds, flood defenses, or livelihood diversification programs—in locations where future economic harm is expected to be greatest. This anticipatory approach reduces the long-term costs of disasters and supports more resilient communities.
8. Program Impact Evaluation at Scale
Measuring whether social programs truly reduce poverty is challenging, especially when interventions are spread across regions and implemented by multiple partners. By integrating survey data, administrative records, and observational datasets like satellite imagery, sophisticated models can estimate program effects in near real time.
This allows funders and policymakers to compare the effectiveness of different approaches—for example, cash transfers versus in-kind food support, or infrastructure investments versus training programs—and allocate budgets toward those with the strongest impact per dollar spent.
9. Privacy-Preserving Approaches to Sensitive Data
Working with data about low-income communities raises serious questions about privacy, consent, and potential misuse. Advanced methods such as anonymization, secure multiparty computation, and differential privacy help protect personal identities while still enabling meaningful analysis.
Responsible use of these methods ensures that insights into deprivation do not expose individuals to harm or discrimination, and that community trust is sustained over time. Ethical governance frameworks and transparent communication with affected populations are essential companions to any data-driven poverty mapping effort.
Conclusion: Turning Insight into Action
Advanced analytical techniques are helping to reveal where poverty is concentrated, how it changes over time, and which interventions have the greatest impact. Yet data alone cannot solve inequality; insight must be paired with political will, community participation, and sustained investment.
The real promise of these methods lies in giving decision-makers a clearer picture of need, so that resources reach those who have been overlooked. When combined with local knowledge and strong social protections, these tools can support a more accurate, more just understanding of who is being left behind—and how to change that reality.